21 December 2017

The Global Education Reform Movement (GERM) in 2017: A Year in Review

First posted at the Ark blog

If the Adam Smith Institute can reclaim the pejorative label ‘neoliberal’, maybe we should be reclaiming the pejorative ‘global education reform movement (GERM)’? Aside from the unfortunate acronym, it’s actually a pretty good description of the cluster of people and organisations trying to shake things up a bit and do things differently in global education policy.

Here’s a round-up of some of my highlights from the GERM in 2017. There has been some solid progress in documenting the scale of the global learning crisis, and steps towards building the kind of global data infrastructure we need to measure the SDG on learning. In 2018 I’d like to see more measurement, and also more experimentation. The conversation in education still needs to shift some more away from “we know how to fix this just give us the cash” to the maybe slightly less compelling but more honest “this is a crisis that needs fixing, we know where we want to get to but we don’t yet know how to get there, so we’re going to throw everything we have at it, and measure the hell out of everything so we can learn and course correct until we get there.”

---

January - The big global education jamboree kicks off each year with the Education World Forum in London, not to be confused with the World Education Forum, the Global Education and Skills Forum, or the World Global Forum for Education and Children Who Can’t Read Good (I might have made up the last one).

George K. Werner, the Minister of Education in Liberia, publishes the first of many articleswritten in 2017 on the controversial Partnership Schools programme. “Less than 60% of school-aged children in Liberia are in school … Those who do attend school may not fare much better: among adult women who reached fifth grade in Liberia, less than 20% can read a single sentence.”

In Colombia, 22 of Bogota’s ‘Concession schools’ (PPP schools, like charters in the US or academies in the UK) re-open for another 10 year contract, after their last contract ended and was renegotiated last year.

February - The second, annual meeting of the Global Schools Forum is launched. The GSF event is a gathering of non-state school operators working in low- and middle-income countries and targeting the bottom half of the income distribution, comes together, networks, and shares ideas. I blogged about my general feelings of inferiority whilst rubbing shoulders with all these inspiring people who have set up their own schools here. Watch out for GSF in 2018, as the annual meeting promises to be even bigger and better!

March - The next big global education jamboree in the calendar is the Global Education and Skills Forum in Dubai. Daisy Christodoulou blogged about how she remarkably managed to win a debate in favour of teaching kids facts in the age of Google. She also reported on a fascinating debate about teaching global versus national values. If you don’t know Daisy, 2007 University Challenge champion, you should really read this superb feature profile by Laura McInerney in SchoolsWeek.

As we don’t (yet) have very good data on actual learning in many developing countries, a growing movement is spreading the idea started by Pratham in India of recruiting citizen-volunteers to administer simple learning assessments on a mass scale. The “People’s Action for Learning” (PAL) network held its 5th annual meeting in Mexico, welcomed Nepal as the newest member, reaching a total of 16 countries.

April - The Government of the Punjab province in Pakistan contracts out the management around 1,000 failing schools to private operators, bringing the total for the first year of the Public School Support Programme (PSSP) to almost 5,000 schools - that’s about how many schools have been converted to Academies in the UK over 16 years!

June - The great and the good of global education research meets in Washington DC for the Research on Improving Systems of Education (RISE) conference (report here). Ark EPG launches its Rigorous Review of the evidence on public-private partnerships in education in developing countries (post 2009). The review only found 22 studies that met the quality criteria, but of these most were positive.

In the Philippines, the senior high school (Grade 11 and 12) voucher programme enters its second year - over 600,000 students started in Grade 11 through the programme last year.

July - The Western Cape government drafted legislation for the creation of a new independent School Evaluation Authority.

Amitav Virmani, CEO of the Education Alliance, blogged an update on South Delhi Municipal Government’s Partnership Schools. Starting with one (Ark) school in 2015, the programme is now up to 29 schools, “While the rest of the system lost 12,000 students last year, these schools doubled their enrolment to 1600 children.”

Education International and ActionAid publishes a critical research report on Partnership Schools for Liberia based on qualitative research in “up to” 20 schools (how many was it?), just 2 months before the actual results would be published from the large-scale RCT which assessed the actual learning of thousands of children in 185 schools, which everyone agreed was a “really helpful” contribution to the dialogue.

August - The 3rd annual “State of the Nation” report on India’s Right to Education Act (Section 12(1)(c)) comes out, highlighting that 5 years after the policy was confirmed, still only 1 in 3 states in India have accessed any federal funding for the programme. This year’s report dives into some of the details of the private school lotteries in states that are actually implementing the policy at scale, including Gujarat, Karnataka, Madhya Pradesh, Maharashtra, and Rajasthan.

September - In a major contribution to the all-too-sparse global data on learning, the UNESCO Institute for Statistics released a new global indicator for reading proficiency (based on PIRLS, TIMSS, and SACMEQ) - finding a headline figure of 387 million children worldwide who can’t read, and of these 2 in 3 are actually attending school, they just aren’t learning.

Results from the 1st year of Partnership Schools for Liberia (PSL) evaluation comes in, with both supporters and critics hailing the results as proving them right. On average PSL schools saw solid improvements in teaching and learning, great for the first year of a pilot, but with some operators spending large amounts of money they raised, and weaknesses in contracting allowing “the largest operator” to move some children and teachers out of their schools.

The World Bank publishes its first ever annual World Development Report focused entirely on education. The report carried many of the same themes as the RISE research programme - highlighting the global learning crisis and calling for more learning assessment and for systemic reforms to try and address the crisis in quality.

UNESCO publishes its flagship Global Education Monitoring Report on the topic of accountability, and easily came away with the prize for best illustrated report.

As part of the above-mentioned South Delhi Government Partnership Schools programme, 2 new Ark-backed schools open this September as part of a plan to grow to 10 schools by 2022.

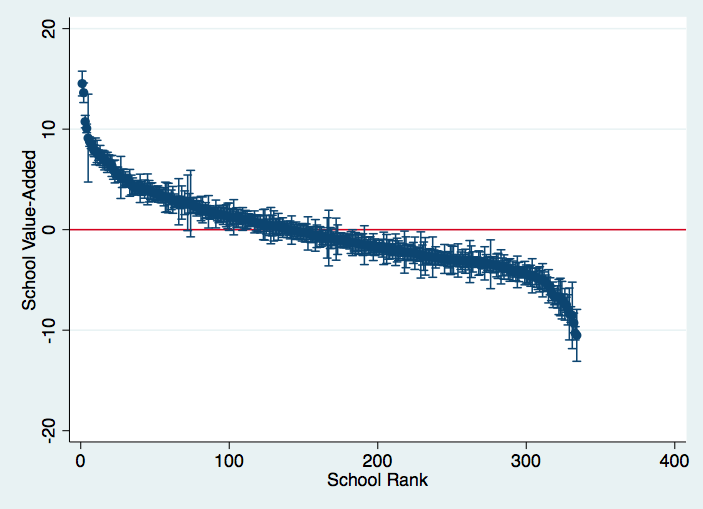
October - The Uganda National Examinations Board (UNEB) announces that starting in 2018, a new measure of secondary school effectiveness will be published based on value-added. This is a fairer way to compare schools than just looking at the level of test scores, which are much more heavily influenced by home background. This will make Uganda the first country in sub-Saharan Africa to use value-added to judge school quality.

November - The UK Parliament International Development Committee publishes its reporton DFID’s work on global education. The report welcomed the results from the PSL study and called for more research into non-state schooling, as well as backing the RISE research programme focused on systems of accountability.

In South Africa, an op-ed-war breaks on South Africa’s collaboration school project, with Equal Education calling the pilot illegal, undemocratic, and unaccountable, to which Education Minister Debbie Shafer replies “We will not be deterred by the likes of Equal Education, who cannot come up with any feasible plan to address the inequalities that still exist as a result of our apartheid legacy,” and David Harrison from the DG Murray Trust adds that the programme “gives parents the right to decide whether or not they want to be part of the experiment.”

At the World Innovation Summit for Education (WISE) in Doha, more progress was made on the nascent “global education ecosystem” project being launched by the Education Commission, R4D, Teach for All, Asia Society, and Brookings. At the exact same time, Pratham were putting these ideas into action, sharing their promising “Teaching at the right level” programme with participants from 12 countries, an idea which according to JPAL is “the most consistently effective at improving learning” from all of their learning-focused RCTs.

December - Just in time for Christmas, the latest international test score results are published - this time in reading from PIRLS. These tests included no low-income countries, and just a handful of lower-middle income countries: Egypt, Georgia, and Morocco. The worst performing country though was upper-middle income South Africa, where 8 out of 10 children can’t read. Nic Spaull provided extensive coverage on very depressing news for South Africa on his must-read blog.

What did I miss?

30 November 2017

How to achieve public policy reform by surprise and confusion

This is a great quote from Simeon Djankov, former Finance Minister of Bulgaria (and founder of the World Bank Doing Business indicators) - pulling slightly in the opposite direction of the Tony Blair school of thought on reform (ruthless prioritisation), Djankov instead suggests go off 7 different directions at once in order to surprise and confuse the opposition.  
"Well, one thing that did certainly affect it is the tactics of how to reform, in the sense that, certainly in academia, you are basically told you need to think deeply. Then there are a lot of pressure groups, lobbies, so you need to talk to them. You need to use the media for communicating the benefits of reform, and so on. Some of the reformers, successful reformers that I spoke with, before I joined the Bulgarian government, basically I said, 'You go, and on Day 1, you surprise everybody. So, you go in every direction you can, because they will be confused what's happening and you may actually be successful in some of the reforms. So, this is what I did. I went to Bulgaria in late July 2009; the Eurozone Crisis had already started around us. Greece was just about to collapse a few months later. So, there was kind of a feeling that something is to happen. But, instead of going, 'Let's now do labor reform,' then, 'Let's do business entry reform,' in the government we literally went 6 or 7 different directions hoping that Parliament will be, you know, confused or too happy to be elected--they were just elected. And we actually succeeded in most of these reforms. When I tried to do meaningful, well-explained reforms two years after, they all got bogged down, because lobbying will essentially take over and, 'Not now; let's wait for next year's government,' and so on."
From the always interesting Econ Talk.

23 November 2017

Innovations in Bureaucracy


Last week I was at the “World Innovation Summit for Education” (WISE) in Doha, and I don’t think I heard the word “bureaucrat” once. Clearly the organisers don’t read Blattman or they would know that Bureaucracy is so hot right now.

The World Bank might be a bit more ahead of the curve here, and held a workshop earlier this month on “Innovating Bureaucracy.” I wasn’t able to attend (ahem, wasn’t invited), and so as the king of conference write-upsdoesn’t seem to have gotten around to it yet, I’ve written up my notes from skimming through the slides (you can read the full presentations here).

Tim Besley — state effectiveness now lies at the heart of the study of development. Incentives, selection, and culture are key, and it is essential to study the 3 together not in isolation.

Michael Best — looks at efficiency of procurement across 100,000 government agencies (each with decentralised hiring) in Russia. Wide variation in prices paid by different individuals/agencies, with big potential for improvement.


Zahid Hasnain — presents Worldwide Bureaucracy Indicators (WWBI) for 79 countries. Public sector employment is 60% of formal employment in Africa & South Asia, and is usually better paid than private employment.


Richard Disney — provides a critique of simple public-private pay gap comparisons — need to consider conditions, pensions, and vocation. Lack of well-identified causal studies.


James L. Perry — 5 key lessons on motivating bureaucrats in developing countries.
(1) select for ‘vocation’
(2) work on prosocial culture
(3) leverage employee-service beneficiary ties
(4) teacher newcomers public service values
(5) develop leaders who model public service values. (full paper here)

Erika Deserranno: Summary of experimental lit on financial & non-financial incentives for workers. Both can work when well designed, or backfire when not. 3 conditions for effective performance-based incentives;
(1) Simple to understand
(2) Linked to measurable targets
(3) Workers can realistically affect targets 


Yuen Yuen Ang — How has China done so well in last 40 years without democratic reform? Through bureaucratic reform which has provided accountability, competition, limits on power. 50 million bureaucrats: 20% managers & 80% frontline workers. Managers have performance contracts focused on outcomes, with published league tables. Frontline workers have large performance-based informal compensation. (bonus podcast edition with Alice Evans here)


Stuti Khemani — research & policy rightly moving from short-route accountability to long-route. Need much more evidence on how public sector workers are selected. One example suggests elected Chairpersons have higher cognitive ability, higher risk aversion, lower integrity.


Jane Fountain — government IT projects fail in part because they’re too large — should move to agile development (build small and quick, get feedback, revise)

Arianna Legovini — improved inspections of health facilities in Kenya seem to be improving patient safety.


Daniel Rogger — new empirics of bureaucracy — World Bank bureaucracy lab investing in substantial new descriptive work on bureaucracy and bureaucrats using both surveys & administrative data, as well as RCTs on reforms

Jim Brumby, Raymond Muhula, Gael Rabelland — two helpful 2x2s — need to understand both capacity & incentive for reform, and then match data architecture to difficulty of measuring performance.


16 October 2017

Open Data for Education

There’s a global crisis in learning, and we need to learn more about how to address it. Whilst data collection is costly, developing countries have millions of dollars worth of data about learning just sitting around unused on paper and spreadsheets in government offices. It’s time for an Open Data Revolution for Education.

The 2018 World Development Report makes clear the scale of the global learning crisis. Fewer than 1 in 5 primary school students in low income countries can pass a minimum proficiency threshold. The report concludes by listing 3 ideas on what external actors can do about it;
  1. Support the creation of objective, politically salient information
  2. Encourage flexibility and support reform coalitions
  3. Link financing more closely to results that lead to learning
The first of these, generating new information about learning, can be expensive. Travelling up and down countries to sit and test kids for a survey can cost a lot of money. The average RCT costs in the range of $0.5m. Statistician Morten Jerven added up the costs of establishing the basic census and national surveys necessary to measure the SDGs — coming to a total of $27 billion per year, far more than is currently spent on statistics.

And as expensive as they can be, surveys have limited value to policymakers as they focus on a limited sample and can only provide data about trends and averages, not individual schools. As my colleague Justin Sandefur has written; “International comparability be damned. Governments need disaggregated, high frequency data linked to sub-national units of administrative accountability.”

Even for research, much of the cutting edge education literature in advanced countries makes use of administrative not survey data. Professor Tom Kane (Harvard) has argued persuasively that education researchers in the US should abandon expensive and slow data collection for RCTs, and instead focus on using existing administrative testing and data infrastructure, linked to data on school inputs, for quasi-experimental analyses than can be done quickly and cheaply.

Can this work in developing countries?
My first PhD chapter (published in the Journal of African Economies) uses administrative test score data from Uganda, made available by the Uganda National Exams Board at no cost, saving data collection that would have cost hundreds of thousands of pounds and probably been prohibitively expensive. We’ve also analysed the same data to estimate the quality of all schools across the country, so policymakers can look up the effectiveness of any school they like, not just the handful that might have been in a survey (announced last week in the Daily Monitor).

Another paper I’m working on is looking at the Public School Support Programme (PSSP) in Punjab province, Pakistan. The staged roll-out of the program provides a neat quasi-experimental design that lasted only for the 2016–17 school year (the control group have since been treated). It would be impossible to go in now and collect retrospective test score data on how students would have performed at the end of the last school year. Fortunately, Punjab has a great administrative data infrastructure (though not quite as open as the website makes out), and I’m able to look at trends in enrolment and test scores over several years, and how these trends change with treatment by the program. And all at next to no cost.

For sure there are problems associated with using administrative data rather than independently collected data. As Justin Sandefur and Amanda Glassman point out in their paper, official data doesn’t always line up with independently collected survey data, likely because officials may have a strong incentive to report that everything is going well. Further, researchers don’t have the same level of control or even understanding about what questions are asked, and how data is generated. Our colleagues at Peas have tried to useofficial test data in Uganda but found the granularity of the test is not sufficient for their needs. In India there is not one but several test boards, who end up competing with each other and driving grade inflation. But not all administrative data is that bad. To the extent that there is measurement error, this only matters for research if it is systematically associated with specific students or schools. If the low quality and poor psychometric properties of an official test are just noisy estimates of true learning, this isn’t such a huge problem.

Why isn’t there more research done using official test score data? Data quality is one issue, but another big part is the limited accessibility of data. Education writer Matt Barnum wrote recently about “data wars” between researchers fighting to get access to public data in Louisiana and Arizona. When data is made easily available it gets used; a google scholar search for the UK “National Pupil Database” finds 2,040 studies.

How do we get more Open Data for Education?
Open data is not a new concept. There is an Open Data Charter defining what open means (Open by default, timely and comprehensive, accessible and usable, comparable and interoperable). The Web Foundation ranks countries on how open their data is across a range of domains in their Open Data Barometer, and there is also an Open Data Index and an Open Data Inventory.

Developing countries are increasingly signing up to transparency initiatives such as the Open Government Partnership, attending the Africa Open Data conference, or signing up to the African data consensus.

But whilst the high-level political backing is often there, the technical requirements for putting together a National Pupil Database are not trivial, and there are costs associated with cleaning and labelling data, hosting data, and regulating access to ensure privacy is preserved.

There is a gap here for a set of standards to be established in how governments should organise their existing test score data, and a gap for financing to help establish systems. A good example of what could be useful for education is the Agriculture Open Data Package: a collaboratively developed “roadmap for governments to publish data as open data to empowering farmers, optimising agricultural practice, stimulating rural finance, facilitating the agri value chain, enforcing policies, and promoting government transparency and efficiency.” The roadmap outlines what data governments should make available, how to think about organising the infrastructure of data collection and publication, and further practical considerations for implementing open data.

Information wants to be free. It’s time to make it happen.

11 October 2017

Why don’t parents value school effectiveness? (because they think LeBron’s coach is a genius)


A new NBER study exploits the NYC centralised school admissions database to understand how parents choose which schools to apply for, and finds (shock!) parents choose schools based on easily observable things (test scores) rather than very difficult to observe things (actual school quality as estimated (noisily!) by value-added).

Value-added models are great — they’re a much fairer way of judging schools than just looking at test scores. Whilst test scores conflate what the student’s home background does with what the school does, value-added models (attempt to) control for a student’s starting level (and therefore all the home inputs up that point), and just looking at the progress that students make whilst at a school.

David Leonhardt put in well;
“For the most part, though, identifying a good school is hard for parents. Conventional wisdom usually defines a good school as one attended by high-achieving students, which is easy to measure. But that’s akin to concluding that all of LeBron James’s coaches have been geniuses.”
Whilst value-added models are fairer on average, they’re typically pretty noisy for any individual school, with large and overlapping confidence intervals. Here’s the distribution of school value-added estimates for Uganda (below). There are some schools at the top and bottom that are clearly a lot better or worse than average (0), but there are also a lot of schools around the middle that are pretty hard to distinguish from each other, and that is using an econometric model to analyse hundreds of thousands of data points. A researcher or policymaker who can observe the test score of every student in the country can’t distinguish between the actual quality of many pairs of schools, and we expect parents to be able to do so on the basis of just a handful of datapoints and some kind of econometric model in their head??


Making school quality visible

If parents don’t value school effectiveness when it is invisible, what happens if we make it visible by publishing data on value-added? There are now several studies looking at the effect of providing information to parents on test score levels, finding that parents do indeed change their behaviour, but there are far fewer studies directly comparing the provision of value-added information with test score levels.

One study from LA did do this, looking at the effect of releasing value-added data compared to just test score levels on local house prices, finding no additional effect of providing the value-added data. But this might just be because not enough of the right people accessed the online database (indeed, another study from North Carolina found that providing parents with a 1-page sheet with information that had already been online for ages already still caused a change in school choice).

It is still possible that publishing and properly targeting information on school effectiveness might change parent behaviour.

Ultimately though, we’re going to keep working on generating value-added data with our partners because even if parents don’t end up valuing the value-added data, there are two other important actors who perhaps might — the government when it is considering how to manage school performance, and the school themselves.

26 September 2017

JOB: Research Assistant on Global Education Policy

I’m hiring a full-time research assistant based in London, for more details see the Ark website here.
 
---
 
Research and evidence are at the heart of EPG’s work. We have:
  • Collaborated with JPAL on a large-scale field experiment on school accountability in Madhya Pradesh, India
  • Commissioned a randomized evaluation by IPA of Liberia’s public-private partnership in primary schooling
  • Led a five-year randomized trial of a school voucher programme in Delhi
  • Helped the Ugandan National Examinations Bureau create new value-added measures of school performance
  • Commissioned scoping studies of non-state education provision in Kenya and Uganda 

Reporting to the Head of Research and Evaluation, the Research Assistant will contribute to EPG’s work through a mixture of background research, data analysis, writing, and organizational activities. S/he will support and participate in ongoing and future academic research projects and EPG project monitoring and evaluation activities.

The role is based in Ark’s London office with some international travel.

The successful candidate will perform a range of research, data analysis, and coordination duties, including, but not limited to, the following: 

  • Conduct literature and data searches for ongoing research projects.
  • Organize data, provide descriptive statistics, and run other statistical analysis using Stata and preparing publication quality graphics
  • Collaborate with EPG’s project team to draft blogs, policy briefs, and notes on research findings.
  • Support EPG’s project team in the design and implementation of project monitoring and evaluation plan
  • Provide technical support and testing on the development of value-added models of school quality
  • Coordination and update of the EPG/GSF research repository
  • Organise internal research and policy seminars
  • Perform other duties as assigned. 

The successful candidate will have the following qualifications and skills: 

  • Bachelor’s (or Master’s) degree in international development, economics, political science, public policy, or a related field.
  • Superb written and verbal communication skills.
  • Competence and experience conducting quantitative research. Experience with statistical software desired.
  • Familiarity with current issues, actors and debates in global education
  • Proven ability to be a team player and to successfully manage multiple and changing priorities in a fast-paced, dynamic environment, all while maintaining a good sense of humor.
  • Outstanding organization and time management skills, with an attention to detail.
  • Essential software skills: Microsoft Office (specifically Excel) and Stata
  • Experience working in developing country contexts or international education policy -- a plus
  • Experience designing or supporting the implementation of research evaluations and interpreting data -- a plus
  • Fluency or advanced language capabilities in French -- a plus
 

05 September 2017

Why is there no interest in kinky learning?


Just *how* poor are *your* beneficiaries though? In the aid project business everybody is obsessed with reaching the *poorest* of the poor. The ultra poor. The extreme poor. Lant Pritchett has criticised extensively this arbitrary focus on getting people above a certain threshold, as if the people earning $1.91 a day (just above the international poverty line) really have substantively better lives than those on $1.89 (just below). Instead he argues we should be focusing on economic growth and lifting the whole distribution, with perhaps a much higher global poverty line to aim at of around $10–15 a day, roughly the poverty line in rich countries.

Weirdly, we have the opposite problem in global education, where it is impossible to get people to focus on small incremental gains for those at the bottom of the learning distribution. Luis Crouch gave a great talk at a RISE event in Oxford yesterday in which he used the term ‘cognitive poverty’ to define those at the very bottom of the learning distribution, below a conceptually equivalent (not yet precisely measured) ‘cognitive poverty line’. Using PISA data, he documents that the big difference between the worst countries on PISA and middling countries is precisely at the bottom of the distribution - countries with better average scores don’t have high levels of very low learning (level 1 and 2 on the PISA scale), but don’t do that much better at the highest levels.


But when people try and design solutions that might help a whole bunch of people get just across that poverty line, say from level 1 or 2 to level 3 or 4 (like, say, scripted lessons), there is dramatic push-back from many in education. Basic skills aren’t enough, we can’t just define low-bar learning goals, we need to develop children holistically with creative problem solving 21st century skills and art lessons, and all children should be taught by Robin Williams from Dead Poet’s Society.

Why have global poverty advocates been so successful at re-orientating an industry, but cognitive poverty advocates so unsuccessful?

06 June 2017

The Continuing Saga of Rwandan Poverty Data

via Ken Opalo, there is new analysis out of the 2014 Rwanda poverty numbers that contradicts official Government reports, finding that poverty actually rose between 2010 and 2014. Professor Filip Reyntjens made a similar argument at the time, which I disagreed with.  

This new (anonymous) analysis in the Review of African Political Economy supports the conclusion of Reyntjens, based on new analysis of the survey microdata (with commendably published stata code). The key difference seems to be that their analysis updates the poverty line based on prices reported in the survey microdata rather than using the official Consumer Price Index (CPI) measure of inflation.

What I took away from this at the time was the apparent fragility of trend data on poverty that depends on consumption aggregates and price data. I also drafting a follow-up blogpost that for whatever reason never got posted, so here it is. 

What else do we know about welfare in Rwanda? 

Given the disagreement about the right price indices to use for calculating the poverty line, it might be informative to look at other indicators of welfare that we might care about, and even better to look at other indicators from a different survey. In fact, it was looking at the first table in the EICV4 Report that made me doubt Filip's claim that poverty had actually increased. This table suggests that between 2010 and 2014,

- inequality was down,
- school attendance and literacy up,
- housing and access to electricity and clean water improved,
- health services improved, and
- household savings were up.

All strong indicators of progress. 

Inequality is down on two different measures (both unaffected by the level of the poverty line) and Food Production is Up


If Rwanda fiddled the poverty numbers, did they also fiddle the entire survey? A useful check is the results from the Demographic and Health Survey (DHS), which as Justin Sandefur and Amanda Glassman have pointed out, tends to have particularly heavy donor involvement, making them particularly difficult for governments to fudge. And the overall impression from the two surveys is strikingly similar – rapid improvements in child and maternal healthcare and health outcomes.

Health Indicators have substantially improved over the same period on the DHS Survey


It's certainly possible that the whole EICV4 was fudged and that consumption poverty increased whilst at the same time health care services and health outcomes improved. To me, it just seems kind of unlikely.

18 April 2017

Someone needs to show Paul Collier how to use Dropbox

"At the end of the lecture, the exhausted Prof Collier carrying a heavy bag was mobbed by autograph-seeking youths who had some questions for him. As the English professor was leaving the hall, a rogue whom he mistook for one of the Ooni’s people asked to assist him with carrying the bag. He handed it to him trustingly and like magic, the thief vanished into the thin air in a twinkle of an eye, with everything gone—money, passport, air ticket and most painful of all, a laptop filled with the professor’s writings. “My soul is missing,” a distraught Prof. Collier told me, a day after."
 

03 April 2017

The Political Economy of Underinvestment in Education

According to this model, the returns to education take so long that leaders need at least a 30 year horizon to start investing in schools.
 
"In the context of developing economies, investing in schools (relative to roads) is characterized by much larger long-run returns, but also by a much more pronounced intertemporal substitution of labor and crowding-out of private investment. Therefore, the public investment composition has profound repercussions on government debt sustainability, and is characterized by a trade-o, with important welfare implications. A myopic government would not invest in social infrastructure at all. The model predicts an horizon of at least thirty years for political leaders to start investing in schools and twice-as-long an horizon for the size of expenditures to be comparable to the socially-optimal level."
 

30 March 2017

A research agenda on education & institutions

From Tessa Bold & Jakob Svensson for the DFID-OPM-Paris School of Economics research programme "EDI"
 
1. A focus on learning in primary is still essential - don’t get too distracted by secondary and tertiary
2. More focus on teachers’ effort, knowledge, and skills
3. How do we go from pilots to scaled-up programs? (and related - can we design interventions that explicitly allow for existing implementation constraints at scale)
4. How can we use ICT to bring down the cost of sharing information on performance?
5. More research on public-private partnerships such as voucher programs

28 March 2017

Stop highlighting our differences? #moreincommon

Last night at my local primary school Governor meeting one of the other governors objected to a table showing a disaggregation of recent pupil discipline issues categorised by ethnic grouping. “Should we really be calling children ‘White Other’ or ‘Black Other’?” Turns out these are the standard official government categories offered to students/parents to self-identify with. As a researcher I'm naturally interested in as many descriptive categories as possible to help understand the factors that drive differences in outcomes between individuals, but every time we ask the question we also ask people to think in ethnic or racial or national terms, highlighting our differences not the more in common. 
 
As Chris Dillow wrote recently in an excellent take-down of David Goodheart:
"The thing is, we all have multiple identities: I’m tall, white, Oxford-educated, bald, heterosexual, male, bourgeois with a working class background, an economist, an atheist with a Methodist upbringing. And so on and on. The question is not: what are my identities? But rather: which of these identities matter?
 
… 
 
Even if you accept biological essentialism, the question of which of our multiple identities becomes salient is surely in large part a social construct.
 
...
 
No good can come from raising the salience of racial or ethnic identities."
The issue comes up often in national censuses. For the last South Sudan census in 2008 it was decided it was too politically charged to ask people their ethnic group. Lebanon hasn’t had a census to count the number of Christians and Muslims since 1932. In the UK, the government recently started asking schools for pupil’s nationalities, with a stated aim of allowing for better targeting of support, but leading to widespread suspicion and calls for a boycott
 
The first step to thinking about when we should and should not ask for ethnic identities might be assigning some plausible values to the likely costs and benefits of doing so. A new paper by Evan S. Lieberman and Prerna Singh has taken a systematic approach and coded over 1000 census questionnaires for 150 countries over 200 years and whether they ask for ethnic identities. 
"Through a series of cross-national statistical analyses, the authors find a robust association between enumeration of ethnic cleavages on the census and various forms of competition and conflict, including violent ethnic civil war”.
That seems like a pretty high price to pay.

23 March 2017

The Political Economy of Public Sector Performance Management Reform

Reflections from Prajapati Trivedi, founding Secretary of the Performance Management Division in the Government of India Cabinet Secretariat, in Governance

"The new government of Prime Minister Modi never formally declared that it is closing the RFD system. It simply stopped asking the departments to prepare RFDs (performance agreements). Indeed, the government went on to appoint three more Secretaries for Performance Management as my successors. The system was, however, allowed to atrophy and no formal answer about the status of the RFD system was either given in the Parliament in response to questions on the topic or was forthcoming under India's Right to Information (RTI) act. Thus, we can only speculate why the RFD system came to an abrupt end.

First, it is possible that the review of the working of the RFD system in the past 4 years by the incoming Modi government revealed a story that did not match their election rhetoric. Modi had portrayed the outgoing government of Singh as weak on governance and could not, therefore, acknowledge the existence of a rigorous system of performance monitoring and evaluation of government departments. After all, it had promised to do in its election manifesto what was already being done.

Second, the review of actual results for the performance of individual government departments perhaps revealed that “reality” of performance was better than the “perception.” It is fair to say that Manmohan Singh lost elections because he could not “talk the walk.” The performance data revealed that on average government departments were achieving 80% of the targets assigned to them via performance agreement (RFDs). By contrast, the opinion polls at the time revealed that the electorate rated the government performance at around only forty percent 40%. Thus, continuing the RFD system would have revealed facts that went against the main narrative on which the government of Modi came to power.

Third, it is possible that the new government found that the performance results for the past 4 years based on the departments' ability to meet agreed commitments did not meet their preconceived biases.

Fourth, a system based on ex ante agreements and objective evaluation of performance at the end of the year reduces discretion and was perhaps seen as inimical to the personalized style of management preferred by the incoming Prime Minister.

And fifth, I have yet to come across any workplace where performance evaluation is welcomed by staff. Senior career civil servants did feel the pressure to perform and were waiting to sow seeds of doubt in the minds of incoming administration. Performance management is a leadership issue and not a popular issue.

There are several key lessons of my experience that may be relevant for policy makers working on a similar system in their own countries.

We succeeded beyond our wildest expectations in terms of the scope and coverage of the performance management policy because we emphasized simplicity over complexity. We defined performance management as simply the ability of the department to deliver what it had promised.

It is my strong conviction that unless you can reduce the performance measurement to a score, it will remain difficult to grasp and hence difficult to sustain over time. For the performance score to be meaningful, however, performance management must be based on ex ante commitments and must cover all aspects of departmental operations.

Performance management is best implemented as a big-bang effort. Pilots in performance management do not survive because those departments chosen as pilots feel they are being singled out for political reasons.

Finally, the single biggest mistake of the outgoing government was to not enshrine the RFD policy in a law. A similar policy for accountability of state-owned enterprises in India was embedded in a law in 1991 and it has survived changes in government." 

09 March 2017

Liberia Fact of the Day

"The treaties that govern space allow private individuals and corporations to travel the stars, but only with the licensure and legal backing of an earthbound government. It’s similar that way to the laws of the sea. And today, on Earth’s oceans, more than 11 percent of all the tons of freight shipped is carried on boats that fly the Liberian flag (In contrast, U.S.-registered ships carry just 0.7 percent of the freight tonnage).
In exchange for lower taxes and looser regulations, both the shipping companies of the present and the Martian explorers of tomorrow could pay to register their vessel with a small country they have no other connection to (Liberia earns more than $20 million a year this way) and carry its flag (and laws) with them, wherever they go."
Maggie Koerth-Baker at 538 (via The Browser)

The key to better education systems is accountability. So how on earth do we do that?

And what do we even actually mean when we talk about accountability?

Perhaps the key theme emerging from research on reforming education systems is accountability. But accountability means different things to different people. To start with, many think first of bottom-up (‘citizen’ or ‘social’) accountability. But increasingly in development economics, enthusiasm is waning for bottom-up social accountability as studies show limited impacts on outcomes. The implicit conclusion then is to revisit top-down (state) accountability. As Rachel Glennerster (Executive Director of J-PAL) wrote recently
"For years the Bank and other international agencies have sought to give the poor a voice in health, education, and infrastructure decisions through channels unrelated to politics. They have set up school committees, clinic committees, water and sanitation committees on which sit members of the local community. These members are then asked to “oversee” the work of teachers, health workers, and others. But a body of research suggests that this approach has produced disappointing results."
One striking example of this kind of research is Ben Olken’s work on infrastructure in Indonesia, which directly compared the effect of a top-down audit (which was effective) with bottom-up community monitoring (ineffective).

So what do we mean by top-down accountability for schools?

Within top-down accountability there are a range of methods by which schools and teachers could be held accountable for their performance. Three broad types stand out:

  • Student test scores (whether simple averages or more sophisticated value-added models)
  • Professional judgement (e.g. based on lesson observations)
  • Student feedback
The Gates Foundation published a major report in 2013 on how to “Measure Effective Teaching”, concluding that each of these three types of measurement has strengths and weaknesses, and that the best teacher evaluation system should therefore combine all three: test scores, lesson observations, and student feedback.

By contrast, when it comes to holding head teachers accountable for school performance, the focus in both US policy reform and research is almost entirely on test scores. There are good reasons for this - education in the US has developed as a fundamentally local activity built on bottom up accountability, often with small and relatively autonomous school districts, with little tradition of supervision by higher levels of government. Nevertheless, as Helen Ladd, a Professor of Public Policy and Economics at Duke University and an expert in school accountability, wrote on the Brookings blog last year:
"The current test based approach to accountability is far too narrow … has led to many unintended and negative consequences. It has narrowed the curriculum, induced schools and teachers to focus on what is being tested, led to teaching to the test, induced schools to manipulate the testing pool, and in some well-publicized cases induced some school teachers and administrators to cheat
Now is the time to experiment with inspections for school accountability … 
Such systems have been used extensively in other countries … provide useful information to schools … disseminate information on best practices … draw attention to school activities that have the potential to generate a broader range of educational outcomes than just performance on test scores … [and] treats schools fairly by holding them accountable only for the practices under their control … 
The few studies that have focused on the single narrow measure of student test scores have found small positive effects."
A report by the US think tank “Education Sector” also highlights the value of feedback provided through inspection systems to schools.
"Like many of its American counterparts, Peterhouse Primary School in Norfolk County, England, received some bad news early in 2010. Peterhouse had failed to pass muster under its government’s school accountability scheme, and it would need to take special measures to improve. But that is where the similarity ended. As Peterhouse’s leaders worked to develop an action plan for improving, they benefited from a resource few, if any, American schools enjoy. Bundled right along with the school’s accountability rating came a 14-page narrative report on the school’s specific strengths and weaknesses in key areas, such as leadership and classroom teaching, along with a list of top-priority recommendations for tackling problems. With the report in hand, Peterhouse improved rapidly, taking only 14 months to boost its rating substantially."
In the UK, ‘Ofsted’ reports are based on a composite of several different dimensions, including test scores, but also as importantly, independent assessments of school leadership, teaching practices and support for vulnerable students.

There is a huge lack of evidence on school accountability

This blind spot on school inspections isn’t just a problem for education in the US, though. The US is also home to most of the leading researchers on education in developing countries, and that research agenda is skewed by the US policy and research context. The leading education economists don’t study inspections because there aren’t any in the places they live.

The best literature reviews in economics can often be found in the “Handbook of Economics” series and the Journal of Economic Perspectives (JEP). The Handbook article on "School Accountability" from 2011 exclusively discusses the kind of test-based accountability that is common in the US, with no mention of the kind of inspections common in Europe and other countries at all. A recent JEP symposium on Schools and Accountability includes a great article by Isaac Mbiti, a Research on Improving Systems of Education (RISE) researcher, on ’The Need for Accountability in Education in Developing Countries” which includes; however, only one paragraph on school inspections. Another great resource on this topic is the 2011 World Bank book, "Making Schools Work: New Evidence on Accountability Reforms”. This 'must-read' 250-page book has only two paragraphs on school inspections.

This is in part a disciplinary point - it is mostly a blind-spot of economists. School inspections have been studied in more detail by education researchers. But economists have genuinely raised the bar in terms of using rigorous quantitative methods to study education. In total, I count 7 causal studies of the effects of inspections on learning outcomes - 3 by economists and 4 by education researchers.


Putting aside learning outcomes for a moment, one study from leading RISE researchers, Karthik Muralidharan and Jishnu Das (with Alaka Holla and Aakash Mohpal), in rural India finds that “increases in the frequency of inspections are strongly correlated with lower teacher absence”, which could be expected to lead to more learning as a result. However, no such correlation was found for other countries in a companion study (Bangladesh, Ecuador, Indonesia, Peru, and Uganda).

There is also fascinating qualitative work by fellow RISE researcher, Yamini Aiyar (Director of the ‘Accountability Initiative’ and collaborator of RISE researchers Rukmini Banerji, Karthik Muralidharan, and Lant Pritchett) and co-authors, that looks into how local level education administrators view their role in the Indian state of Bihar. The most frequently used term by local officials to describe their role was a “Post Officer” - someone who simply passes messages up and down the bureaucratic chain - “a powerless cog in a large machine with little authority to take decisions." A survey of their time use found that on average a school visit lasts around one hour, with 15 minutes of that time spent in a classroom, with the rest spent “checking attendance registers, examining the mid-day meal scheme and engaging in casual conversations with headmasters and teacher colleagues … the process of school visits was reduced to a mechanical exercise of ticking boxes and collecting relevant data. Academic 'mentoring' of teachers was not part of the agenda.”

At the Education Partnerships Group (EPG) and RISE we’re hoping to help fill this policy and research gap, through nascent school evaluation reforms supported by EPG in Madhya Pradesh, India, that will be studied by the RISE India research team, and an ongoing reform project working with the government of the Western Cape in South Africa. Everything we know about education systems in developing countries suggests that they are in crisis, and that a key part of the solution is around accountability. Yet we know little about how school inspections - the main component of school accountability in most developed countries - might be more effective in poor countries. It’s time we changed that.

This post appeared first on the RISE website

05 March 2017

Rising DFID Spending hasn't Crowded Out Private Giving

Last week I was poking around the ESRC’s 'Administrative Data Research Network’ and discovered the Charity Commission data download website - containing every annual financial return made by every individual charity in England and Wales since 2007. The data comes in a slightly weird file format that I’d never heard of, but thankfully the NCVO have a very helpful guide and Python code for converting the data into .csv format (which was easy enough to use that I managed to figure out how to run without ever having really used Python). 

One obvious question you could ask with this data is whether the private income of international charities has dropped as DFID spending has gone up (more than doubled over the same period) - it is conceivable that people might decide that they could give less to international charity as more of their tax money is being distributed by DFID.

That does not seem to be the case at all. There are two ways of identifying international charities - by their stated area of operation, or by their stated objective category. I’ve coded charities that have no UK activities as “International”, and also picked out the charities that ticked the box for "Overseas Aid/Famine Relief” as their activity category. These two categories do overlap but far from perfectly. 

Charities have multiple categories of income - I focus here on the ‘voluntary’ category which basically means all donations, whether large or small. 

Charities with exclusively international activities, and those focused on 'overseas aid' did appear to take more of a hit than domestic charities from the 2008 global financial crisis and recession, but since then growth has tracked the income of other charities (and is 40-50% higher in 2015 than in 2007 (not adjusting for inflation)). 


You can download the Stata code here, csv files (large) here, and variable descriptions here.

02 March 2017

Introducing... the Global Schools Forum


There’s nothing like sitting in a room full of people who build and run schools in the developing world to make you feel pretty inadequate. At least I did, last week at the Global Schools Forum. It can feel like a pretty long and abstract chain from the kind of policy research and evaluation that I do through to better policies and better outcomes, and I envy being able to see directly a tangible difference for real people.

You may have heard of the emergence of some international low-cost private school chains such as Bridge International Academies, but the movement is growing quickly, and there are many new organisations trying to do similar things that you probably haven’t heard of - some profit-making, some non-profit, some that charge fees, some that don’t, international, local, big, small, and everything in between. The biggest school operator you don’t hear that much about is the Bangladeshi NGO BRAC, who run thousands and thousands of fee-free schools.

Last week a whole range of school operators and the donors who support them gathered at the 2nd Annual Meeting of the “Global Schools Forum” (GSF); a new membership organisation of 26 school networks (of which 14 for profit and 12 non-profit) operating in 25 countries, and 17 donors and financing organisations, with networks ranging from 1 to 48,000 schools. Running one school is hard enough; trying to disrupt a dysfunctional system by growing a chain of schools is harder. One of the goals of the GSF is to help create a community of practice for school operators, and a “How-to Guide” for scale, sharing information about the best IT and finance systems, the best assessments for tracking performance, or the best training consultants. It’s a place to connect operators with new people and new ideas.

This year we heard more about public-private partnerships than last year, in part because of the presence of several of the operators in the Partnership Schools for Liberia (PSL) pilot. Government schools (with government teachers) will be managed by a range of local and international providers, including the Liberian Stella Maris Polytechnic and LIYONET, international NGOs (Street Child, BRAC, More Than Me) and school chains (Bridge International Academies, Rising Academies, Omega Schools). Other operators at the forum came from India (Gyanshala, Seed Schools, Sodha Schools), South Africa (SPARK, Streetlight Schools, African School for Excellence, Nova Pioneer), and East Africa (Peas, Silverleaf Academies, Kidogo, Scholé), to name just a few.

So what?

The number of non-state school operators planning for scale is rapidly increasing, but even at dramatic rates of growth, it would take a long time to reach any kind of significant proportion of schools. There are two possible routes to scale - either growing chains and networks to scale themselves, and/or acting as demonstration projects for government, to prove what is possible. This second route was highlighted by a number of speakers. Anecdotally at least, many exciting school reforms seem to come from the personal experience of government Ministers actually seeing something better in practice with their own eyes. More rigorously, Roland Fryer has demonstrated in the US with a randomized experiment that it is possible to “inject charter school best practices into public schools” and achieve positive gains in learning.

To find out more about the Global Schools Forum keep an eye on the website (coming soon) globalschoolsforum.org and follow @GSF_talks on twitter.

The Global Schools Forum is supported by The Education Partnerships Group (EPG) @EPG_Edu, UBS Optimus Foundation @UBSOptimus, Pearson Affordable Learning Fund @AffordableLearn, and Omidyar Network @OmidyarNetwork.

14 February 2017

LSE on the UK gov’s new housing plans

"The fundamental problems with housing remain the same as in the last fifteen years and of those the most fundamental is the lack of land for development. Only fundamental reforms of our housing supply process will help and this proposes none. Indeed it in some ways goes backwards. It goes from a set of (not very good) mechanisms delivered in 2007 with the Regional Spatial Strategies to a set of aspirational gestures. Frankly the Secretary of State could build more houses with a magic wand."
From the Spatial Economics Research Centre blog

03 February 2017

Cash-on-Delivery Aid for Trade Facilitation

One of the new ideas in our CGD trade-for-development-policy-after-Brexit paper was using the "Cash on Delivery" approach for trade facilitation. "Cash on Delivery" is an idea well developed by Nancy Birdsall and William Savedoff but still under-actually-piloted, and as yet not proposed for use in trade facilitation, for which it may actually be a really good fit. From the paper:

"The UK can improve upon its existing Aid for Trade offer by making increased use of results-based programmes. “Cash-on-delivery” aid (paying for outcomes, not inputs) is most appropriate where local contextual knowledge matters, where the best combination of inputs is uncertain and local experimentation is needed, and where precise design features and implementation fidelity are most critical (see, for example, the discussion by Savedoff [2016] on energy policy). All of these criteria also apply to Aid for Trade.

A typical Aid for Trade programme might carry out an extended diagnostic project to identify the constraints to change, and then design and contract a project to address these constraints. The payments would typically be made for activities (for example, technical assistance for improving a certain process) that, according to a theory of change, should lead to the desired outcomes. But contracting for activities and inputs doesn’t allow for sufficient experimentation and change.

A better approach is to contract for outcomes (i.e., to offer cash on delivery) and allow those with the required information the flexibility to determine the best way of achieving those outcomes.

Common concerns around cash on delivery focus on exactly what outcomes are contracted for, how they are measured, and whether there is any risk of distortion of priorities according to what is measurable or gaming of indicators. Indicators should be quantifiable, ideally continuous (to allow for variable payment in proportion to the degree of progress), and independently verifiable. Another common concern is how governments might fund any up-front investment costs. Here, then, the proposal is not that cash on delivery should replace all aid, but simply that it replace a portion of aid in a piloted manner. Further, if the outcomes are focused on “soft” rather than “hard” infrastructure, these up-front costs should be limited.

With trade, contracts could be based on the World Bank’s ‘Doing Business’ indicators. We have reasonable econometric evidence (Hoekman and Nicita 2011) that these indicators of the cost of importing and exporting (in both time and money) are associated with greater volumes of imports and exports.

An alternative but similar set of possible indicators that could be used as outcomes for contracted payments are the OECD Trade Facilitation Indicators, which probe border procedures in more detail. Moïsé and Sorescu (2013) estimate that streamlining the costs represented by these indicators could reduce trade costs by 15 per cent for low- and lower-middle-income countries.

Rather than trying to tell a specific country how best to reduce that time and cost, we could instead just write a contract to pay a specified amount for each hour the country reduces the time it takes goods to clear the border and exporters and/or importers to comply with documentary requirements.

The potential gains to developing countries are high. The estimated gain to a low-income country from reducing its cost of exporting to that of a middle-income country is 2 per cent higher exports (Hoekman and Nicita 2011). For a typical low-income country, such as Malawi, with total annual exports of around US$1.5 billion, a 2 per cent increase would be worth US$30 million a year. The expenses associated with reducing export times would almost certainly cost less than this amount.

In summary, the UK could take the lead in applying a more innovative and potentially much more effective approach to Aid for Trade by using cash on delivery. It could be used as a complement to the other proposals in this note and, as a relatively new approach, could be established relatively promptly as a pilot."